Choosing Low Carbon Steel in 2026 requires more than comparing price lists or familiar grade numbers. The right decision begins with the application, forming method, joining process, and service environment. A thin enclosure may need excellent ductility and a clean surface. A structural bracket may require higher yield strength, predictable welding, and reliable dimensional control. Small details matter.
Buyers should review mill certificates, applicable standards, testing methods, and traceability records before approving material. Recycled content can support lower embodied emissions, but it should not replace verified product data. Ask suppliers how carbon figures were calculated, which production stage they cover, and whether independent verification exists. These questions often reveal gaps between marketing language and measurable performance.
Low Carbon Steel usually offers practical benefits, including easy fabrication, broad availability, and competitive cost. However, it may need coatings or design protection in humid, salty, or chemically aggressive environments. A lower purchase price can become expensive after repainting, repairs, or premature replacement. The answer is contextual. Engineers should compare total lifecycle cost, not only the invoice value.
Experienced teams also test representative samples when tolerances, surface quality, or welding behavior are critical. Laboratory results help, but workshop feedback remains valuable. A grade that performs well on paper may create difficulties during bending or assembly. That assumption can fail. This guide examines grade selection, carbon reporting, supplier reliability, fabrication needs, and practical checks for 2026 purchasing decisions. It does not promise one universal choice. Instead, it offers a careful framework for matching material evidence with real operating conditions.
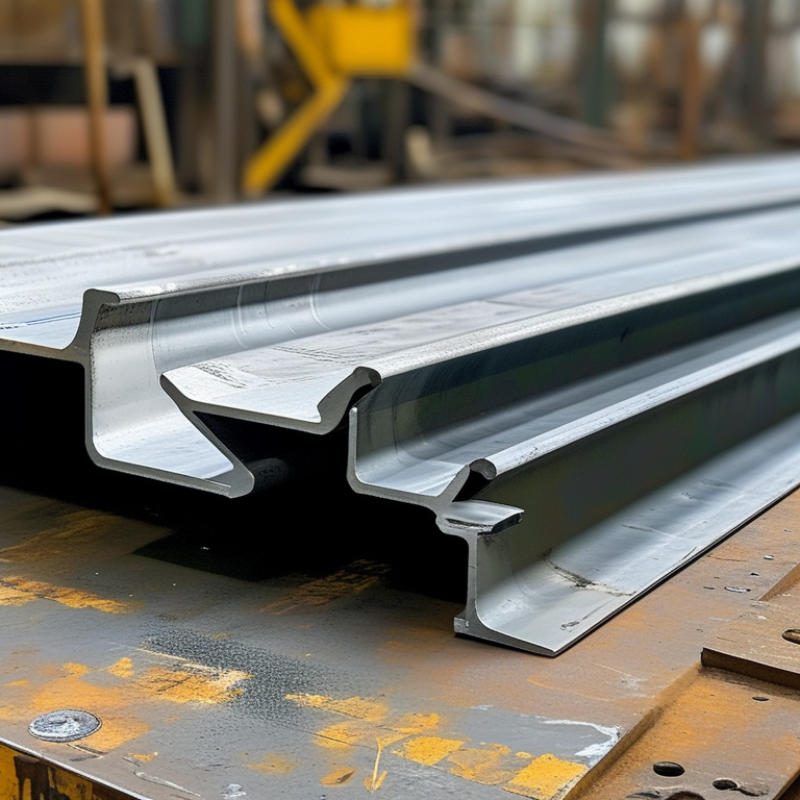
When choosing low-carbon steel in 2026, start with a clear reference point. Worldsteel reports an industry average of about 1.9 tonnes of CO₂ per tonne of crude steel. This figure is useful, but it is not a universal definition. “Low-carbon” should mean steel produced below that benchmark, under a clearly stated emissions boundary.
Ask whether the data covers Scope 1 and Scope 2 emissions. Check if purchased electricity, raw materials, transport, and finishing are included. A tonne made in an electric furnace may show lower direct emissions, yet its result depends heavily on the electricity source. Production routes also matter. Scrap content, furnace efficiency, and coal use can change the footprint significantly.
Request a product carbon footprint or independently verified environmental declaration. Check the reporting year, functional unit, allocation method, and plant location. Numbers without boundaries can mislead. A supplier quoting 0.7 tonnes of CO₂ per tonne may be credible, but only if the calculation method is transparent. I would not accept a lower figure automatically. The benchmark itself can change as global production improves. Procurement teams should compare equivalent data, record the steel grade and heat number, and confirm performance requirements. Carbon reduction cannot justify poor weldability, inconsistent thickness, or premature replacement. That trade-off is easy to overlook.
How to Choose Low Carbon Steel in 2026?
Carbon intensity should be the first comparison point, but not the only one. A conventional BF–BOF route often produces about 1.8–2.3 t CO₂e per tonne of crude steel. It relies heavily on iron ore and uses little scrap. Its emissions come mainly from coal-based reduction and high-temperature processing.
EAF steel can reach roughly 0.3–0.8 t CO₂e/t when powered by low-carbon electricity. Scrap may provide 70–100% of the metallic input. However, electricity generation changes the result sharply. An EAF using carbon-intensive power may perform worse than expected. Scrap quality also affects energy use, residual elements, and final-grade control. The numbers need checking.
DRI–EAF routes usually fall near 0.8–1.4 t CO₂e/t with natural gas, depending on the plant and electricity mix. Hydrogen-based DRI could reduce emissions toward 0.1–0.4 t CO₂e/t when renewable power and hydrogen are genuinely available. Scrap shares commonly range from 10–40%, because DRI supplies cleaner iron units for demanding products. Yet hydrogen projects remain limited, and announced capacity is not operating capacity.
Ask suppliers for the production route, scrap percentage, electricity source, system boundary, and third-party emissions data. Scope 1 alone can mislead. A quoted figure may exclude mining, purchased electricity, or downstream rolling. I would compare certified cradle-to-gate CO₂e/t figures, then confirm chemistry, strength, delivery reliability, and recycled content. The cheapest carbon number is not always the most credible.
Choosing low carbon steel in 2026 requires more than comparing price per tonne. A common shop-floor mistake is selecting the highest strength grade without checking weldability. ASTM A36 offers a minimum yield strength of 36 ksi and suits general plates, brackets, and frames. ASTM A572 Grade 50 raises minimum yield strength to 50 ksi, potentially reducing plate thickness and structural weight. Stronger is not always better.
EN 10025 provides a useful European comparison. S235JR has a 235 MPa minimum yield strength, while S355JR reaches 355 MPa. The suitable choice depends on loading, thickness, temperature, and fabrication method. Welders should review carbon equivalent, hydrogen control, preheating, and heat input. Thick S355 sections may need more disciplined procedures than thinner S235 parts. Small details matter.
The World Steel Association reported approximately 1.88 billion tonnes of crude steel production in 2024. The International Energy Agency also estimates steel production creates about 2.6 gigatonnes of direct carbon dioxide emissions annually. These figures support careful material efficiency, but “low carbon” should not mean blindly choosing thinner steel. A572 Grade 50 or S355 can reduce mass, yet processing energy and welding requirements may offset some benefits. ASTM and EN values are not perfectly interchangeable. That comparison needs restraint. Reviewing mill certificates, project calculations, and qualified welding procedures remains essential.
| Standard | Grade | Minimum Yield Strength | Tensile Strength | Relative Strength Level | Weldability | Typical Applications | Best Selection Rationale |
|---|---|---|---|---|---|---|---|
| ASTM A36 | A36 | 36 ksi / 250 MPa for common plate thickness ranges |
58–80 ksi / 400–550 MPa | Baseline structural strength | Good | General structural frames, base plates, brackets, gussets, tanks, and welded assemblies | Choose when economical fabrication, broad availability, and straightforward welding are more important than weight reduction or high yield strength. |
| ASTM A572 | Grade 42 | 42 ksi / 290 MPa | 60 ksi / 415 MPa minimum | Moderately higher than A36 | Good with qualified procedures | Structural members, plates, bridges, transportation equipment, and general welded construction | Choose when a modest strength increase over A36 is required without moving to the higher-strength A572 grades. |
| ASTM A572 | Grade 50 | 50 ksi / 345 MPa | 65 ksi / 450 MPa minimum | About 39% higher yield than A36 | Good with qualified procedures | Heavy structural frames, bridges, cranes, towers, truck components, and welded load-bearing parts | Choose when higher strength can reduce plate thickness or structural weight while retaining practical weldability. |
| ASTM A572 | Grade 60 | 60 ksi / 415 MPa | 75 ksi / 520 MPa minimum | High-strength structural option | Good, but procedure control is more important | High-load structural components, heavy equipment, bridges, and weight-sensitive fabrications | Choose when the design benefits significantly from high yield strength; control heat input, consumables, joint preparation, and preheat as required. |
| EN 10025-2 | S235JR | 235 MPa minimum for thickness up to 16 mm |
360–510 MPa | Comparable to basic structural steel | Good | General construction, support frames, platforms, machinery structures, and welded fabrications | Choose for standard European structural work where moderate strength, easy fabrication, and JR impact classification are suitable. |
| EN 10025-2 | S275JR | 275 MPa minimum for thickness up to 16 mm |
410–560 MPa | Intermediate structural strength | Good | Buildings, bridges, industrial structures, machinery bases, and welded load-bearing components | Choose when S235JR is not strong enough but a higher-strength S355 grade is unnecessary. |
| EN 10025-2 | S355JR | 355 MPa minimum for thickness up to 16 mm |
470–630 MPa | Higher-strength structural steel | Good with qualified procedures | Heavy structures, bridges, cranes, pressure-free support structures, and weight-sensitive welded assemblies | Choose when higher yield strength can reduce section size or material weight while meeting European design requirements. |
| Selection notes: Yield strength and tensile strength can vary with product form, thickness, and delivery condition. ASTM A572 chemical requirements and EN 10025 weldability depend on the specified grade, product thickness, heat treatment, and product certificate. JR denotes impact testing at +20°C under EN 10025-2; other impact classes such as J0 and J2 are selected when lower-temperature toughness is required. For welded structures, confirm the applicable standard edition, thickness range, carbon equivalent, preheat, heat input, filler metal, and welding procedure qualification before fabrication. | |||||||
How to Choose Low Carbon Steel in 2026?
An Environmental Product Declaration, or EPD, is not simply a green label. Under ISO 14025, it presents verified life-cycle information using defined rules. Check the product category rules before comparing steel products. Different rules can produce different boundaries and assumptions.
Start with greenhouse-gas coverage. Confirm whether the EPD reports production emissions from raw materials, energy, transport, and processing. Review reported modules, such as A1 to A3, rather than accepting one attractive carbon figure. Corporate Scope 1 and Scope 2 emissions are not identical to product-level EPD data. Scope 3 may appear through purchased materials or upstream transport, but its treatment varies. Read the boundary carefully.
The declared unit also matters. One tonne of steel may describe production impacts, while one square metre of finished structure may reflect a building application. Compare identical units, material grades, and performance requirements. Otherwise, the comparison is weak. Numbers can mislead.
Check the data year and the EPD’s validity period. A declaration based on old electricity data may not represent a mill’s current energy mix. Look for primary facility data, regional electricity assumptions, recycled content, and allocation methods. Independent verification improves confidence, but it does not remove every limitation. In practice, procurement teams sometimes overvalue a lower number and overlook durability or strength. That is a real blind spot. A careful review records uncertainties instead of hiding them. Date matters.
Representative cradle-to-gate greenhouse-gas intensity benchmarks by steelmaking route. Values are shown in kg CO₂e per declared unit of 1 metric tonne of crude steel and are intended for EPD screening, not as a product-specific claim.
When auditing an EPD, confirm the declared unit, life-cycle modules, GHG Scope 1, Scope 2 and relevant Scope 3 coverage, calculation method, electricity treatment, and data year. Lower intensity alone is not sufficient if the EPD uses a different declared unit, incomplete modules, or outdated inventory data.
Reference basis: representative international steel-sector ranges for BF–BOF, scrap-based EAF, natural-gas DRI–EAF and hydrogen-based DRI–EAF production. Actual EPD results vary by feedstock, energy mix, allocation rules, geography and reporting year.
How to Choose Low Carbon Steel in 2026?
Low carbon steel needs more than a small emissions number. The International Energy Agency estimates that steel creates about 7–9% of global carbon dioxide emissions. The World Steel Association reported roughly 1.89 billion tonnes of crude steel production in 2023. At this scale, weak evidence can create serious procurement risks.
Ask suppliers for a ResponsibleSteel Chain-of-Custody audit, not only a product brochure. The audit checks whether certified inputs, production records, and customer claims follow a defined accounting method. Independent assurance providers examine site controls, material flows, and documented procedures. Request the audit scope, covered facilities, validity dates, and findings. Details matter.
Do not stop at a certificate.
A mass-balance claim may be credible, but it does not mean every delivered tonne came from one low-emission furnace. Ask how emissions were measured, which boundaries were used, and whether renewable electricity claims were separately verified. The Greenhouse Gas Protocol and IEA both stress consistent boundaries for meaningful comparisons. Those comparisons remain imperfect.
In practice, compare carbon intensity per tonne, production route, recycled content, and chain-of-custody evidence together. Keep delivery records and supplier declarations for later review. A polished document can still hide gaps. That uncomfortable possibility deserves attention in every 2026 purchasing decision.